10.7 Tanscriptomics Single-Omics Quick-Start Example
This section walks through a complete and standard analysis workflow for transcriptomics data, from data import to advanced functional profiling, using example datasets.
Example data download: Github link
10.7.1 Importing Transcriptomics Data
For single-omic data where no relationship table is involved, the sampleID in the abundance matrix must match those in the Sample phenotypic data.
library(EasyMultiProfiler)

meta_data <- read.table('col.txt',header = T,row.names = 1)

data <- read.table('rna.txt',header = T,sep = '\t')
data <- data[!duplicated(data[,1]),] # remove some duplicated gene due to excel

MAE <- EMP_easy_import(data = data,coldata = meta_data,type = 'normal')
10.7.2 Exploring Transcriptomics Data
View Current Transcriptomics Assay
MAE |>
  EMP_assay_extract() # View expression matrix

MAE |>
  EMP_coldata_extract() # View phenotype data

MAE |>
  EMP_rowdata_extract() # View gene annotations
10.7.3 Batch Effect Correction (Optional)
Correct for Batch Effects by Collection Site
MAE |>
  EMP_assay_extract() |>
  EMP_adjust_abundance(.factor_unwanted = 'Region',
                       .factor_of_interest = 'Group',
                       method = 'combat_seq')
10.7.4 Gene Identifier Conversion
The EMP package includes built-in annotation sets for Human, Mouse, Pig, and Zebrafish.
Convert SYMBOL to ENTREZID
MAE |>
  EMP_assay_extract() |>
  EMP_feature_convert(from = 'SYMBOL',to = 'ENTREZID',species = 'Human')
Convert SYMBOL to ENSEMBL
MAE |>
  EMP_assay_extract() |>
  EMP_feature_convert(from = 'SYMBOL',to = 'ENSEMBL',species = 'Human')
Use a Custom OrgDb Package if Your Species is Not Built-in EMP
library(org.Hs.eg.db)
MAE |>
  EMP_assay_extract() |>
  EMP_feature_convert(from = 'SYMBOL',to = 'ENSEMBL',OrgDb = org.Hs.eg.db)
10.7.5 Add Gene-Disease Associations
Add Disease Associations (Currently Supports Human_disease and Mouse_disease)
MAE |>
  EMP_assay_extract() |>
  EMP_feature_convert(from = 'SYMBOL',add ='Human_disease') |>
  EMP_assay_extract(pattern = 'cancer',pattern_ref = 'Human_disease')
10.7.6 Abundance Transformation
MAE |>
  EMP_assay_extract() |>
  EMP_decostand(method = 'log2+1')
10.7.7 Core Gene Identification (Optional)
Identify Core Gene Set Using the edgeR Algorithm
MAE |>
  EMP_assay_extract() |>
  EMP_identify_assay(method = 'edgeR',
                     min = 10,min_ratio = 0.7)
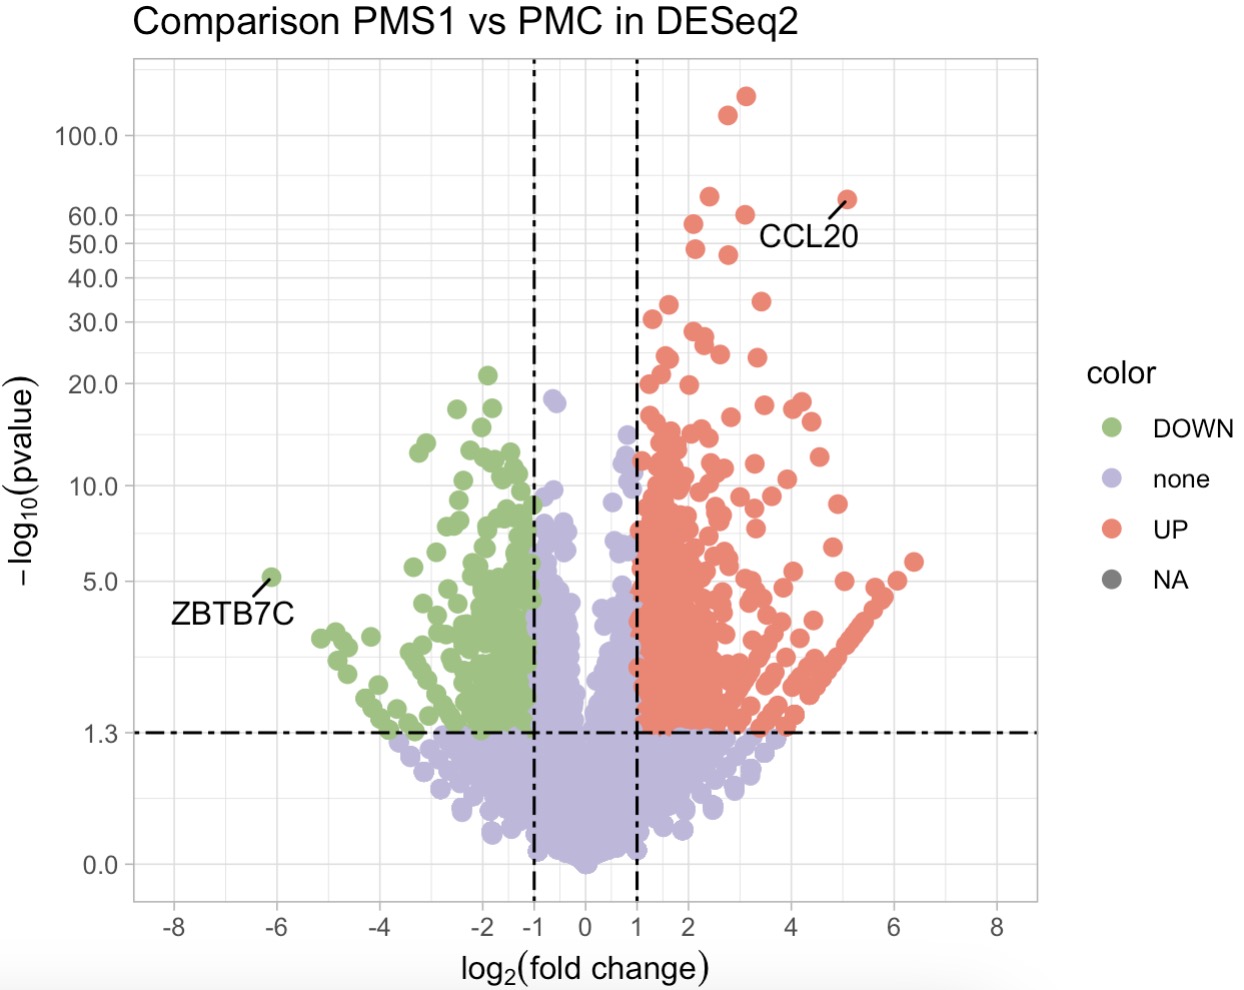
10.7.8 Differential Expression Analysis
Perform Differential Analysis with DESeq2 and Generate Volcano Plot
MAE |>
  EMP_assay_extract() |>
  EMP_filter(Group %in% c('PMC','PMS1')) |>
  EMP_diff_analysis(method = 'DESeq2',.formula = ~Group) |>
  EMP_volcanol_plot(show='pic',key_feature = c('CCL20','ZBTB7C'),
                    palette = c('#FA7F6F','#96C47D','#BEB8DC'),
                    dot_size = 2.5,threshold_x = 1,mytheme = "theme_light()",
                    min.segment.length = 0, seed = 42, box.padding = 0.5)
More Differential Analysis Methods with Significance Filtering
MAE |>
  EMP_assay_extract() |>
  EMP_filter(Group %in% c('PMC','PMS1')) |>
  EMP_diff_analysis(method = 'edgeR_quasi_likelihood',.formula = ~Group) |>
  EMP_filter(feature_condition = pvalue < 0.05,keep_result = TRUE)

MAE |>
  EMP_assay_extract() |>
  EMP_filter(Group %in% c('PMC','PMS1')) |>
  EMP_diff_analysis(method = 'edgeR_likelihood_ratio',.formula = ~Group) |>
  EMP_filter(feature_condition = pvalue < 0.05,keep_result = TRUE)

MAE |>
  EMP_assay_extract() |>
  EMP_filter(Group %in% c('PMC','PMS1')) |>
  EMP_diff_analysis(method = 'edger_robust_likelihood_ratio',.formula = ~Group) |>
  EMP_filter(feature_condition = pvalue < 0.05,keep_result = TRUE)

MAE |>
  EMP_assay_extract() |>
  EMP_filter(Group %in% c('PMC','PMS1')) |>
  EMP_diff_analysis(method = 'limma_voom',.formula = ~Group) |>
  EMP_filter(feature_condition = pvalue < 0.05,keep_result = TRUE)

MAE |>
  EMP_assay_extract() |>
  EMP_filter(Group %in% c('PMC','PMS1')) |>
  EMP_diff_analysis(method = 'limma_voom_sample_weights',.formula = ~Group) |>
  EMP_filter(feature_condition = pvalue < 0.05,keep_result = TRUE)
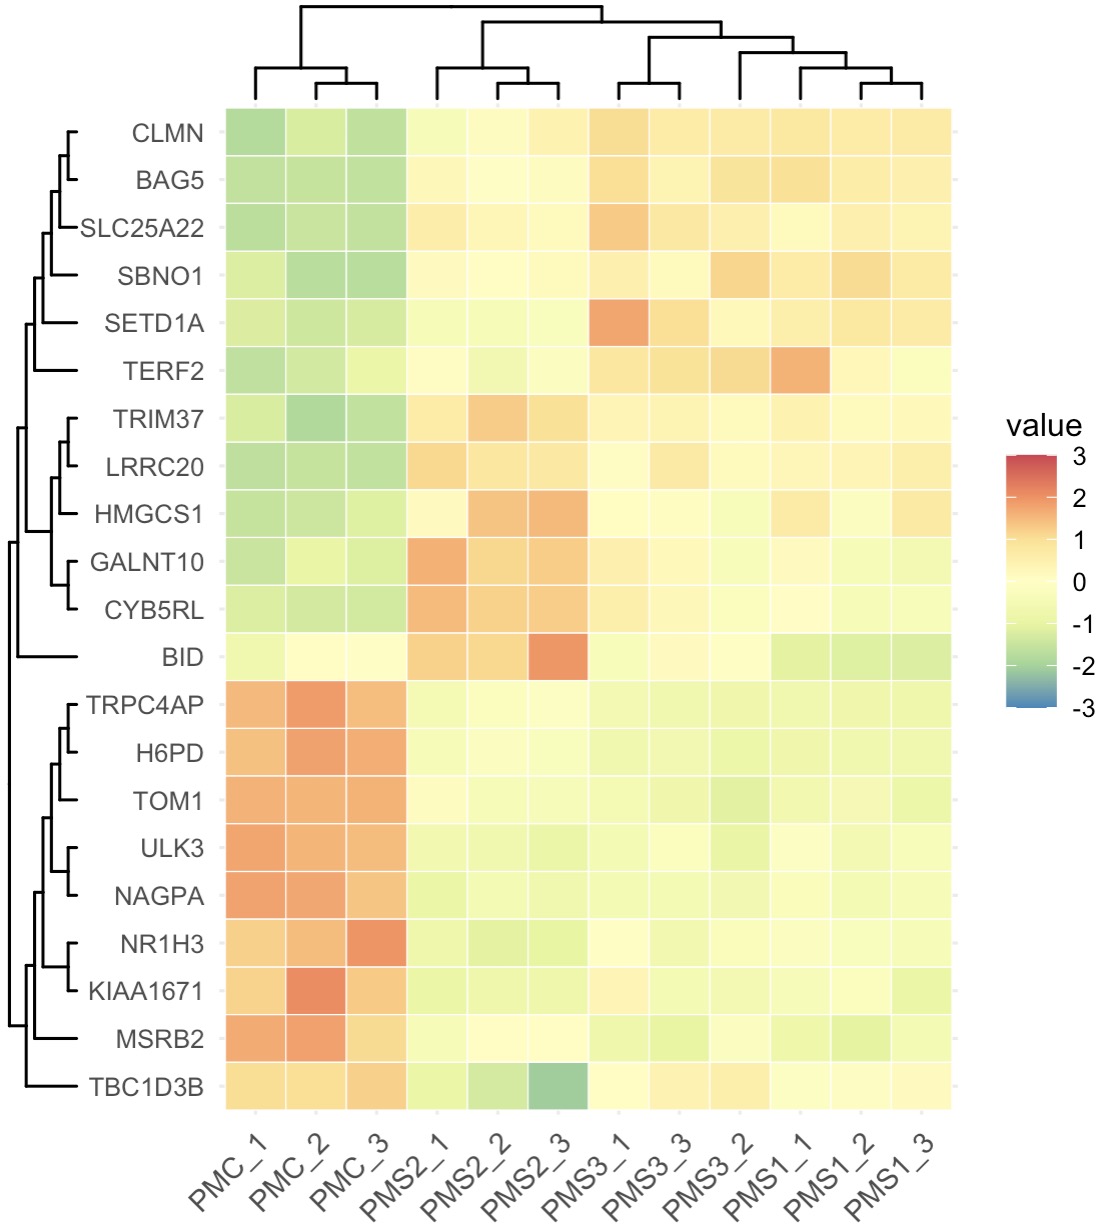
10.7.9 Machine Learning for Feature Selection
The EMP package includes Boruta, Random Forest, XGBoost, and Lasso for feature selection. For details, run help(EMP_marker_analysis).
Rapid Feature Selection with Boruta
MAE |>
  EMP_assay_extract() |>
  EMP_marker_analysis(method = 'boruta',estimate_group = 'Group') |>
  EMP_filter(feature_condition = Boruta_decision!= 'Rejected') |>
  EMP_heatmap_plot(palette='Spectral',legend_bar='auto',
                   scale='standardize',
                   clust_row=TRUE,clust_col=TRUE)
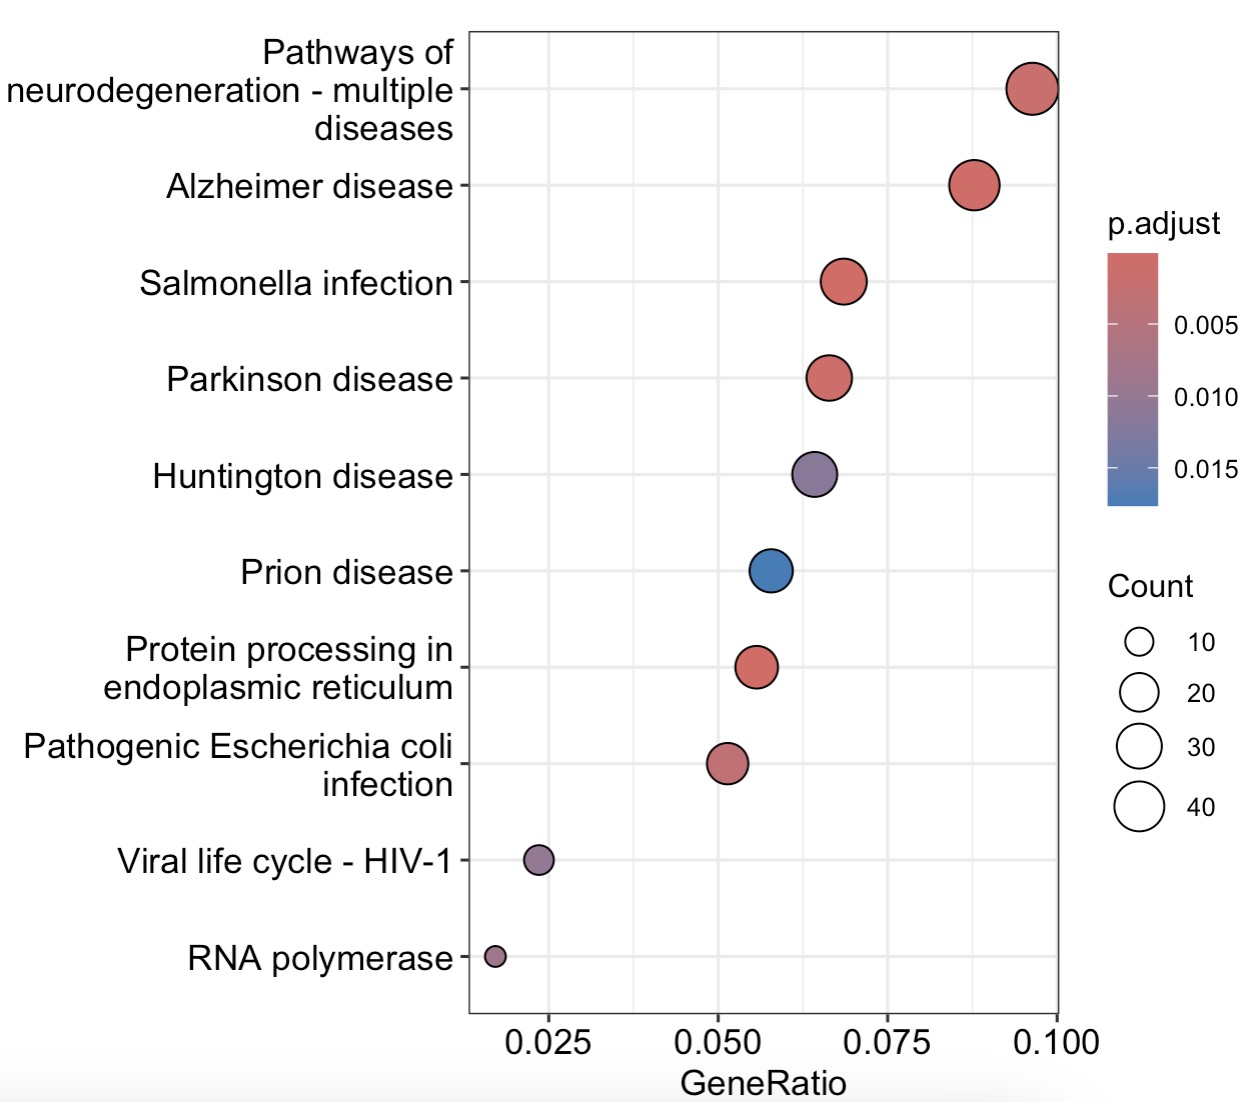
10.7.10 Over-Representation Analysis (ORA)
options(timeout = 180) # Increase timeout for database fetching
KEGG Enrichment
MAE |>
  EMP_assay_extract() |>
  EMP_feature_convert(from = 'SYMBOL',to = 'ENTREZID',
                      species = 'Human') |>
  EMP_filter(Group %in% c('PMC','PMS1')) |>
  EMP_diff_analysis(method='DESeq2',.formula = ~Group) |>
  EMP_enrich_analysis( pvalue<0.05,keyType ='entrezid',
                       KEGG_Type = 'KEGG',species='hsa',
                      pvalueCutoff=0.05) |>
  EMP_enrich_dotplot()
GO Enrichment
library(org.Hs.eg.db)
MAE |>
  EMP_assay_extract() |>
  EMP_feature_convert(from = 'symbol',to='entrezid',species='Human') |>
  EMP_filter(Group %in% c('PMC','PMS1')) |>
  EMP_diff_analysis(method = 'DESeq2',.formula = ~Group,
                    p.adjust = 'fdr') |>
  EMP_enrich_analysis(pvalue<0.05,method = 'go',OrgDb=org.Hs.eg.db,
                      ont='MF',readable=TRUE,pvalueCutoff=0.05) |>
  EMP_enrich_dotplot(show=6)
DOSE Enrichment
MAE |>
  EMP_assay_extract() |>
  EMP_feature_convert(from = 'symbol',to='entrezid',
                      species='Human') |>
  EMP_filter(Group %in% c('PMC','PMS1')) |>
  EMP_diff_analysis(method = 'DESeq2',
                    .formula = ~Group,p.adjust = 'fdr') |>
  EMP_enrich_analysis(pvalue<0.05,method = 'do',ont="HDO",
                      organism= 'hsa',readable=TRUE,
                      pvalueCutoff=0.05) |>
  EMP_enrich_dotplot(show=5)
Reactome Enrichment
MAE |>
  EMP_assay_extract() |>
  EMP_feature_convert(from = 'symbol',to='entrezid',
                      species='Human') |>
  EMP_filter(Group %in% c('PMC','PMS1')) |>
  EMP_diff_analysis(method = 'DESeq2',.formula = ~Group,
                    p.adjust = 'fdr') |>
  EMP_enrich_analysis(pvalue<0.05,method = 'Reactome',organism= 'human',
                      readable=TRUE,pvalueCutoff=0.05) |>
  EMP_enrich_dotplot()
10.7.11 GSEA Enrichment
options(timeout = 180) # Increase timeout for database fetching
Three ranking methods are available for GSEA. The examples below demonstrate KEGG enrichment.
You can apply the same parameter same from ORA to perform GSEA with GO, DOSE, and Reactome.
KEGG GSEA with Signal2Noise Ranking
MAE |>
  EMP_assay_extract() |>
  EMP_feature_convert(from = 'SYMBOL',to = 'ENTREZID',species = 'Human') |>
  EMP_filter(Group %in% c('PMC','PMS1')) |>
  EMP_GSEA_analysis(pvalue<0.05,method='signal2Noise',
                    estimate_group = 'Group',species = 'hsa',
                    pvalueCutoff = 1,keyType = 'entrezid') |>
  EMP_GSEA_plot(geneSetID='hsa04930')
KEGG GSEA with Log2FC Ranking
MAE |>
  EMP_assay_extract() |>
  EMP_feature_convert(from = 'SYMBOL',to = 'ENTREZID',
                      species = 'Human') |>
  EMP_filter(Group %in% c('PMC','PMS1')) |>
  EMP_diff_analysis(method='DESeq2',.formula = ~0+Group,
                    group_level=c('PMC','PMS1')) |>
  EMP_GSEA_analysis(method='log2FC',enrich_method = 'kegg',
                    species = 'hsa',keyType = 'entrezid',
                    pvalueCutoff = 0.05) |>
  EMP_GSEA_plot(geneSetID='hsa04950')
KEGG GSEA with Correlation-Based Ranking
MAE |>
  EMP_assay_extract() |>
  EMP_feature_convert(from = 'SYMBOL',to = 'ENTREZID',
                      species = 'Human') |>
  EMP_filter(Group %in% c('PMC','PMS1')) |>
  EMP_GSEA_analysis(method='cor',enrich_method = 'kegg',
                    keyType='entrezid',estimate_group = 'NR5A2',
                    cor_method = 'spearman',
                    pvalueCutoff = 0.05,species='hsa') |>
  EMP_GSEA_plot(geneSetID='hsa05415')
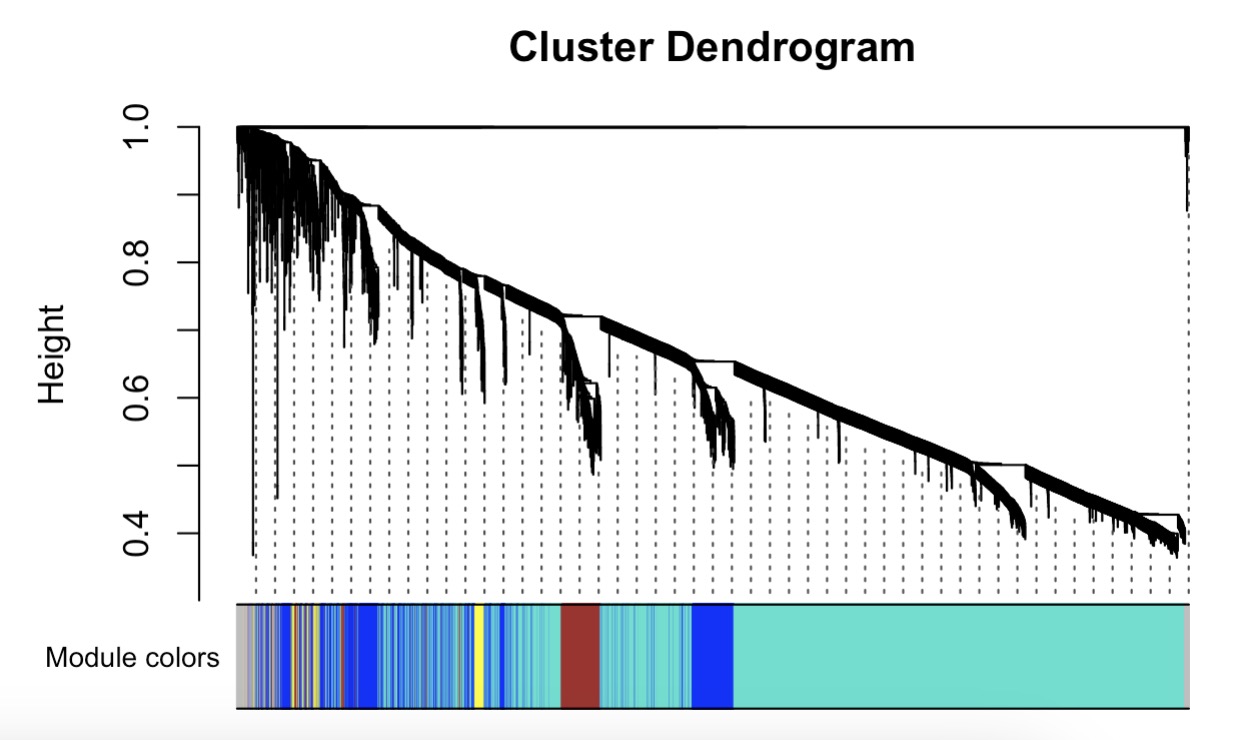
10.7.12 WGCNA Analysis
Step 1: Cluster Analysis Based on Phenotype
MAE |>
  EMP_assay_extract()  |>
  EMP_identify_assay(method = 'edgeR',estimate_group = 'Group') |>
  EMP_feature_convert(from = 'SYMBOL',to = 'ENTREZID',species = 'Human') |>
  EMP_WGCNA_cluster_analysis()
Step 2: Generate Heatmap of Phenotype-Correlated Gene Modules
MAE |>
  EMP_assay_extract()  |>
  EMP_identify_assay(method = 'edgeR',estimate_group = 'Group') |>
  EMP_feature_convert(from = 'SYMBOL',to = 'ENTREZID',species = 'Human') |>
  EMP_WGCNA_cluster_analysis()  |>
  EMP_WGCNA_cor_analysis(coldata_to_assay = c('NR5A2','HNF4G','HNF1B','PAX4','RFX6','NEUROG3'),
                         method='spearman') |>
  EMP_heatmap_plot(palette = 'Spectral')

Step 3: Enrichment Analysis for Selected Gene Modules
MAE |>
  EMP_assay_extract()  |>
  EMP_identify_assay(method = 'edgeR',estimate_group = 'Group') |>
  EMP_feature_convert(from = 'SYMBOL',to = 'ENTREZID',species = 'Human') |>
  EMP_WGCNA_cluster_analysis()  |>
  EMP_WGCNA_cor_analysis(coldata_to_assay = c('NR5A2','HNF4G','HNF1B','PAX4','RFX6','NEUROG3'),
                         method='spearman') |>
  EMP_heatmap_plot(palette = 'Spectral') |>
  EMP_filter(feature_condition = WGCNA_color == 'blue' ) |>
  EMP_enrich_analysis(keyType = 'entrezid',species = 'hsa') |>
  EMP_enrich_dotplot()